Know which lever moved your growth last quarter.
Arcliftio surfaces cohort-level attribution — separating real expansion signal from noise in your retention, channel, and pricing data. Built for Series B+ SaaS teams.
Your metrics vs. your answers
Your metrics show what changed. Arcliftio shows why.
ChartMogul and Baremetrics give you a dashboard. Arcliftio adds a reasoning layer — cohort segmentation × channel attribution × pricing event correlation — so you can walk into the board meeting knowing the cause, not just the effect.
The three questions every board meeting surfaces
Which cohort drove the NRR improvement? Which channel is producing customers who actually stay? Did the pricing change work? Arcliftio answers all three — cohort-level, connected to your existing data.
Cohort Attribution
Track retention and expansion by cohort — acquisition month, plan tier, channel, or custom segment. Surface which cohorts are driving NRR and which are eroding it.
Channel Signal
Connect marketing channel to downstream retention — not just first-touch conversion. Identify which acquisition channels produce cohorts with 12-month retention above your median.
Pricing Attribution
Measure the cohort-level impact of pricing changes. Separate natural churn from price elasticity. Know within 90 days whether your last price move worked.
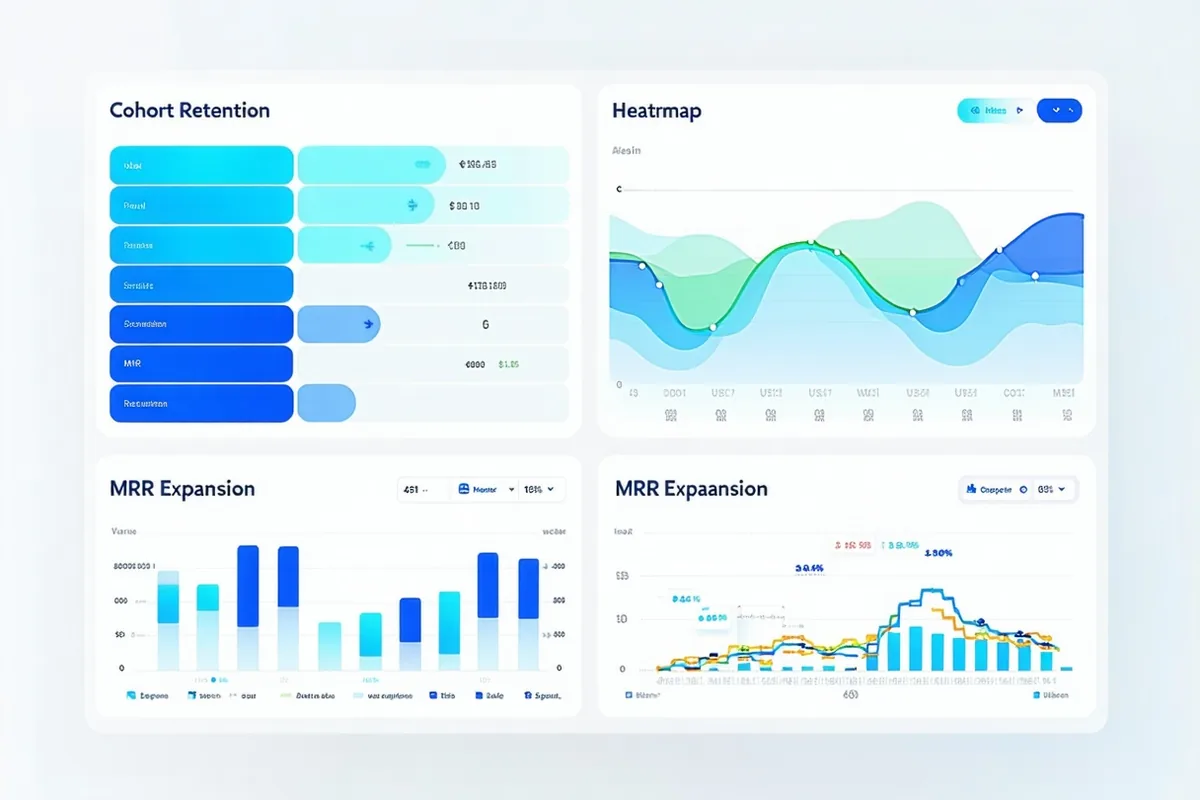
The analysis your MRR dashboard doesn't run
Cohort curves that show the full story
Not a single blended retention number — stratified curves per acquisition cohort, with breakpoints that correlate to product events, pricing changes, or channel shifts.
Explore cohort attribution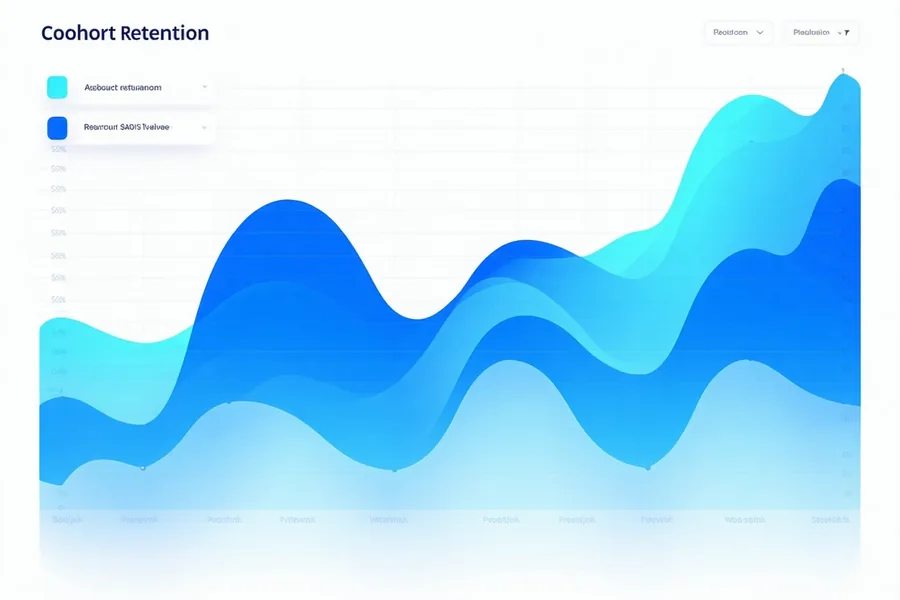
Attribution that survives a board question
Built-in growth accounting framework: new, expansion, contraction, churn, and resurrection — broken down by any dimension your finance team needs.
See the full platform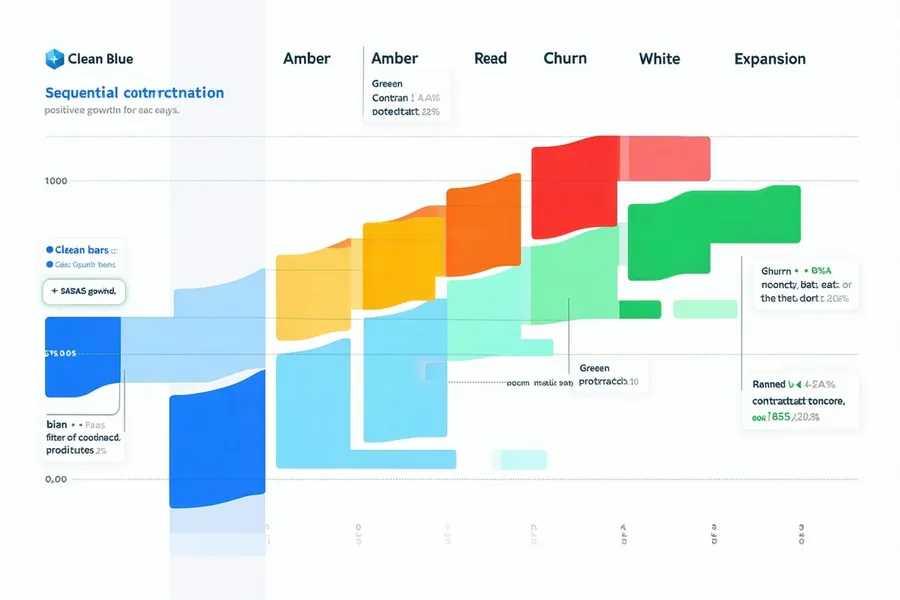
Teams that moved from guessing to knowing
We finally stopped guessing which pricing change drove the Q3 retention dip. Arcliftio had the cohort breakdown built in 20 minutes after connecting Stripe.
Our finance team was spending two days a month rebuilding the same MRR waterfall. Now it's a live dashboard. Growth accounting has never been this fast.
The channel retention view was the missing piece. We cut paid acquisition budget by 30% on channels that looked great on CAC but were churning fast.
Start seeing growth signals in 48 hours.
Connect Stripe in under 5 minutes. First cohort analysis runs automatically.