Three attribution layers. One platform.
Cohort retention, channel performance, and pricing signal — the three analyses your growth review needs, connected to your billing and CRM data. No custom engineering required.
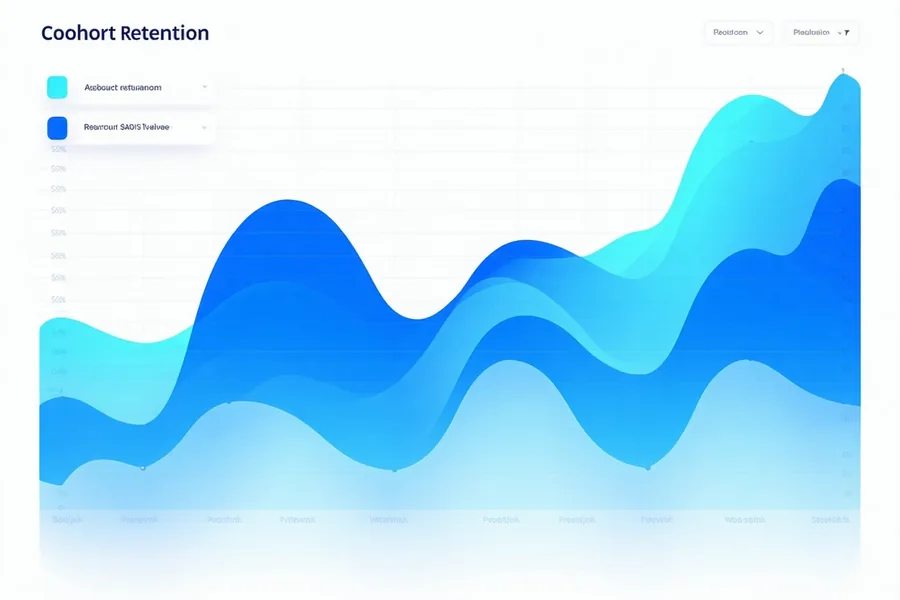
Cohort Attribution
Build any cohort — by acquisition month, plan, geography, channel, or custom event. Layer in product activity signals to identify the moments that correlate with long-term retention.
- Monthly acquisition cohort defaults, ready in 48 hours
- Custom cohort builder with unlimited dimensions
- Retention curve overlays — compare any two cohort groups
- Breakpoint detection: flag cohort inflection events automatically
Channel Attribution
Map acquisition channel to 90-day, 180-day, and 12-month retention rates. Compare cohort behavior across organic, paid, referral, and direct — not just first-touch conversion.
- Channel retention matrix: see LTV curve per acquisition source
- CAC efficiency adjusted for cohort churn rate
- Multi-touch attribution models (first, last, linear, time-decay)
- Channel comparison: rank channels by 12-month retention, not CAC alone

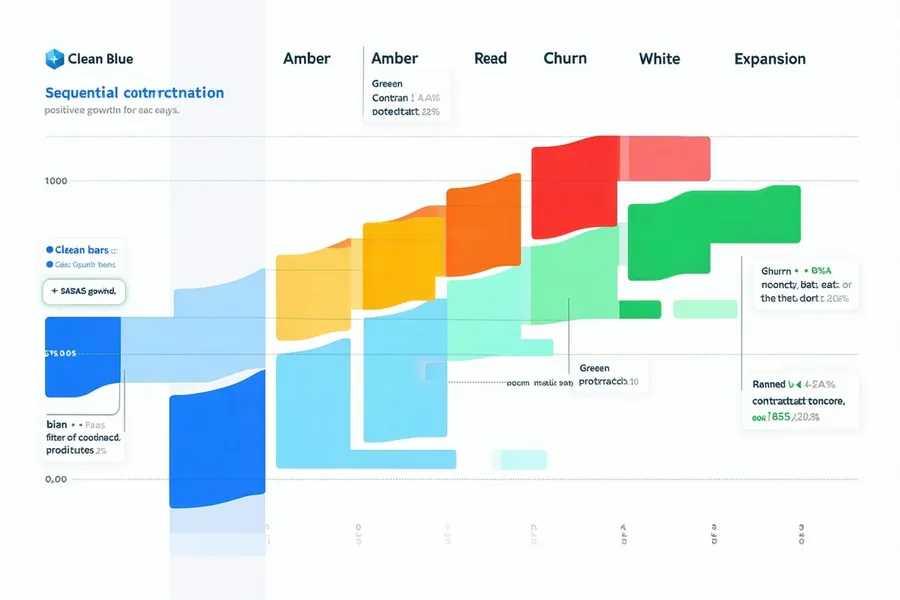
Pricing Signal Attribution
Every pricing change is a cohort experiment. Arcliftio isolates the effect — controlling for natural churn seasonality — so you measure price elasticity, not noise.
- Pricing event detection: auto-flag cohorts impacted by plan changes
- Control group comparison: price-event cohort vs. adjacent period cohort
- Elasticity model: estimate demand sensitivity within 90 days
- Audit trail: track all price changes and their downstream retention impact
Not a BI tool. Not a replacement for Looker or Tableau.
If you need a general-purpose analytics layer, Looker or Tableau will serve you well. Arcliftio is narrow by design: cohort-level attribution for subscription revenue — specifically the three questions that every Series B+ growth review surfaces but no dashboard answers cleanly. We do one thing: connect the cause to the change in your NRR.
See all three layers working together.
Connect your first data source in under 5 minutes. No data engineering required.